Hello families,
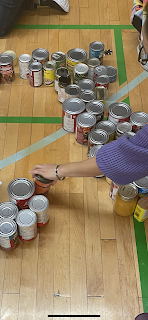
This week the grade 2/3 classes got to practice some data management in Math while also calculating the amount of items collected for the Veteran's food bank. At the beginning of the week our class looked at pictographs and how to read them. Then students had practice on how to create a tally graph and pictograph. Students then had a chance to go into the gym and sort out the items by different categories and tally the items. In small groups we counted the category we were assigned and then reported back to the whole class. Once we gathered the data for each item, the next challenge was to add the different categories together to solve for our total. This was some tricky math but everyone worked really hard!
Lastly, we used our data and applied our knowledge of graphing this week to create a pictograph for our Veteran's food bank donations.
I can collect, display and interpret data to solve problems.
Wedensday, November 24th Library Day please return all books
Wednesday, November 24th- Community Walk 1:20 PM-2:50 PM
Thursday, November 25th Conferences 4-7 PM
Friday, November 26th Conferences 8AM-1PM
*Please schedule a time for conferences if you haven't done so already.


Thanks for sharing this mathematical work with us, Mr. Jackson and students of Room 8. We appreciated all of your learning around data management & I observed how important it was for you to be accurate in your tallies. Thanks for those of you who donated to the Veteran's Food Bank. Your generosity is appreciated.
ReplyDelete